Will Your CPU Bottleneck Your Graphics Card?

How to figure out whether your system is going to put a damper on your video card upgrade plans
Tax refund, graduation gift, bonus from work... you've got some long green burning a hole in your pocket and you want to use it for a sweet video card upgrade. There's just one hiccup: Your rig isn't exactly up to date with the most whizz-bang hardware. You might wonder how to determine if your video card upgrade will be held back by your CPU. In order to answer that question, it's important to know what a bottleneck is, what happens when a bottleneck occurs, and some examples so that you're aware of it when it occurs.
What Is a Bottleneck?
A bottleneck is when a PC is performing a very demanding application and it appears that some aspect of the application can (or should) be performing better. In games, a telltale sign of a bottleneck is that the video card achieves much lower benchmark scores and performance than what most people with the same setup experience. As the performance of the CPU and the video card are largely responsible for how well the game runs, the blame is put on the CPU for causing the performance bottleneck, hence "CPU bottleneck."
Fortunately, there's one easy test to figure out whether you'll have a CPU bottleneck: Monitor the CPU and GPU loads while playing a game. If the CPU load is very high (about 70 percent or more) and significantly higher than the video card's load, then the CPU is causing a bottleneck.
What's going on in a Bottleneck Condition?
Using video games as an example, a typical application cycle could look like this:
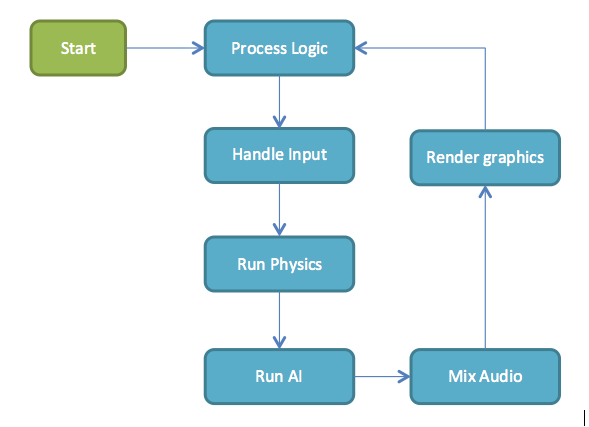
A simplified flowchart of how a video game runs.
When the CPU is under heavy load, it has trouble running through this loop in a timely manner. For example, in order to meet a buttery-smooth 60fps, the CPU has to reach the "Render Graphics" step in 1/60 of a second, or less. If the CPU can't, then it's going to perform that step less often. If the video card is more than capable of rendering the game at a frame rate faster than 60fps, then it will sit idly until the CPU gives it render commands.
This issue is similar on old eight-bit consoles, when there was too much going on at once. The game's logic would try to be done in 1/60 of a second. If it couldn't complete all of the processing in that time, another 1/60 of a second would be used, which would result in a slow-down effect.
Keep up to date with the most important stories and the best deals, as picked by the PC Gamer team.
How To Monitor Your System
In order to monitor your rig's CPU and video card load, you'll need to set up a couple of programs that will capture data over time. For monitoring the CPU, Windows has a built-in tool called Performance Monitor. To monitor the video card, the GPU profiling tool GPU-Z (https://www.techpowerup.com/gpuz) comes with a logger that captures data.
To start Performance Monitor:
1. Go to Control Panel > System and Security > Administrative Tools, right-click Performance Monitor, and select "Run as administrator."
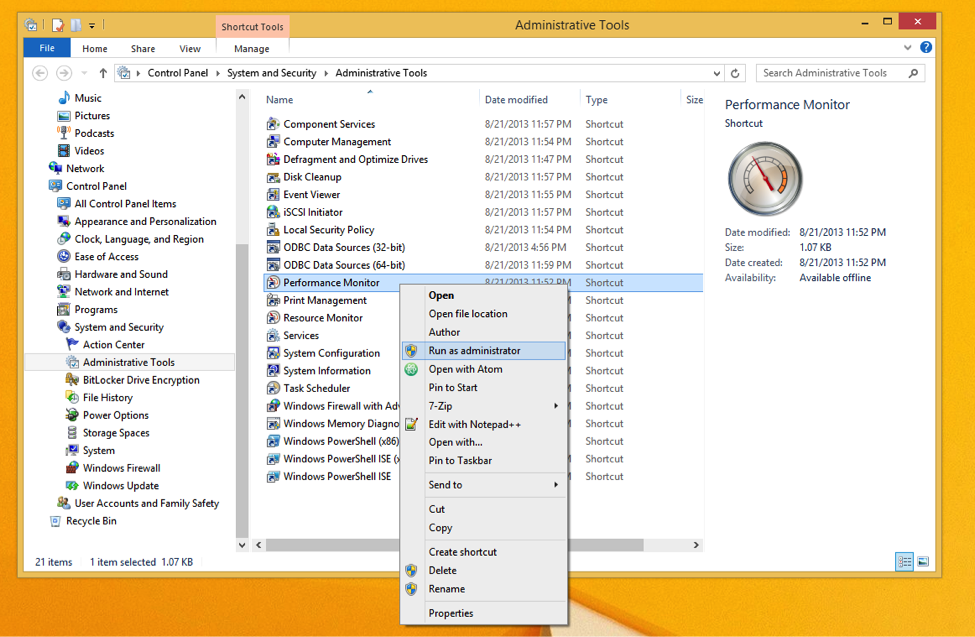
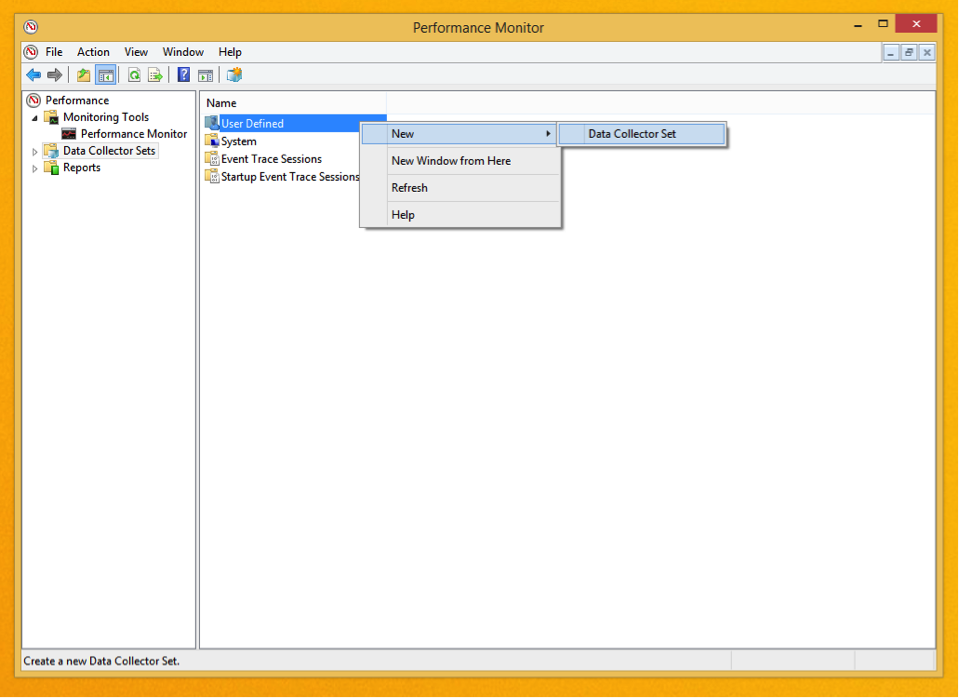
2. Select "Data Collector Sets" from the left pane, then right-click "User Defined" in the right pane, and select New > Data Collector Set. This will open a wizard.
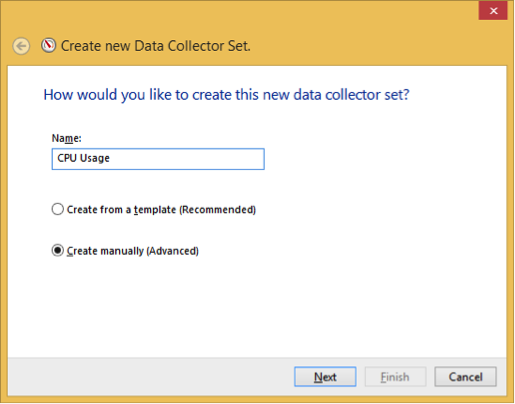
3. Name the Data Collector Set and choose "Create manually (Advanced)," then click "Next."
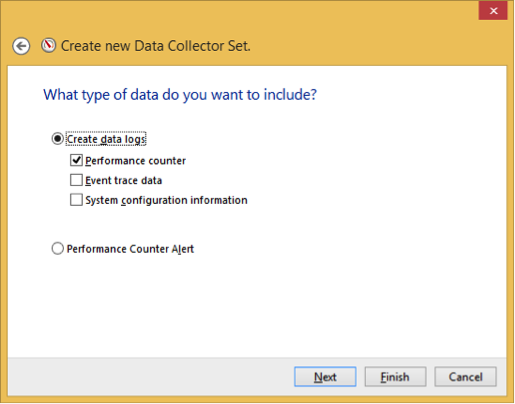
4. In "What type of data do you want to include?," select "Create data logs," and check only "Performance counter." Then click "Next." Picture
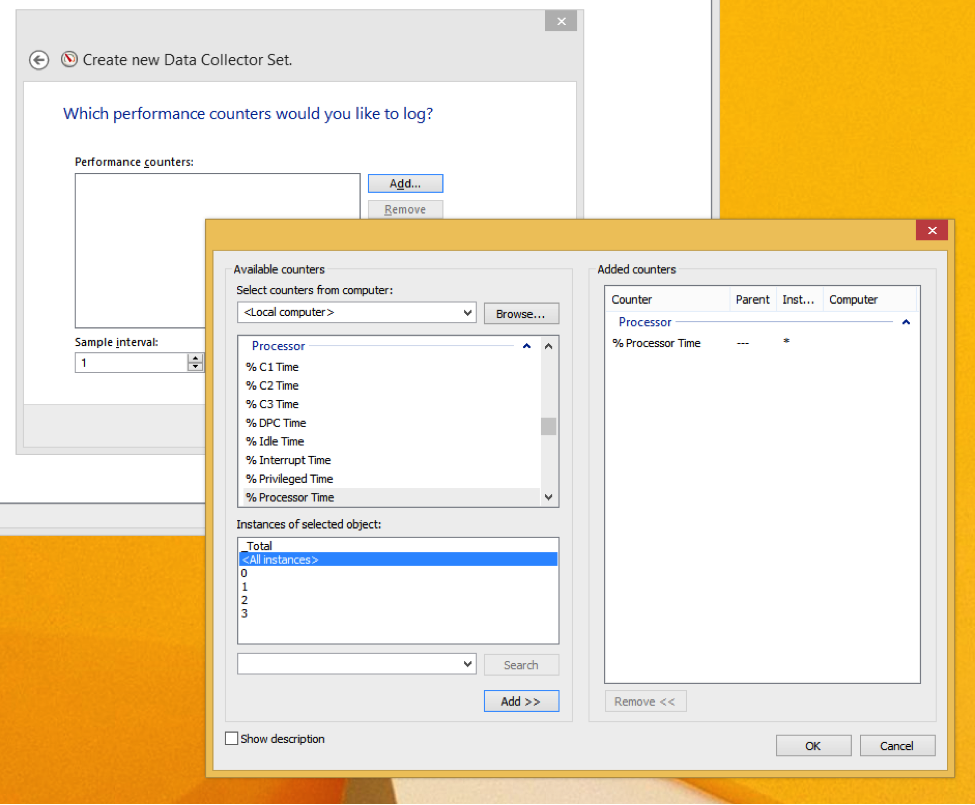
5. In "Which performance counter would you like to log?," click the "Add..." button. Look for the "Processor" category and expand it. Select "% Processor Time," and in the "Instances of selected object" below, add "
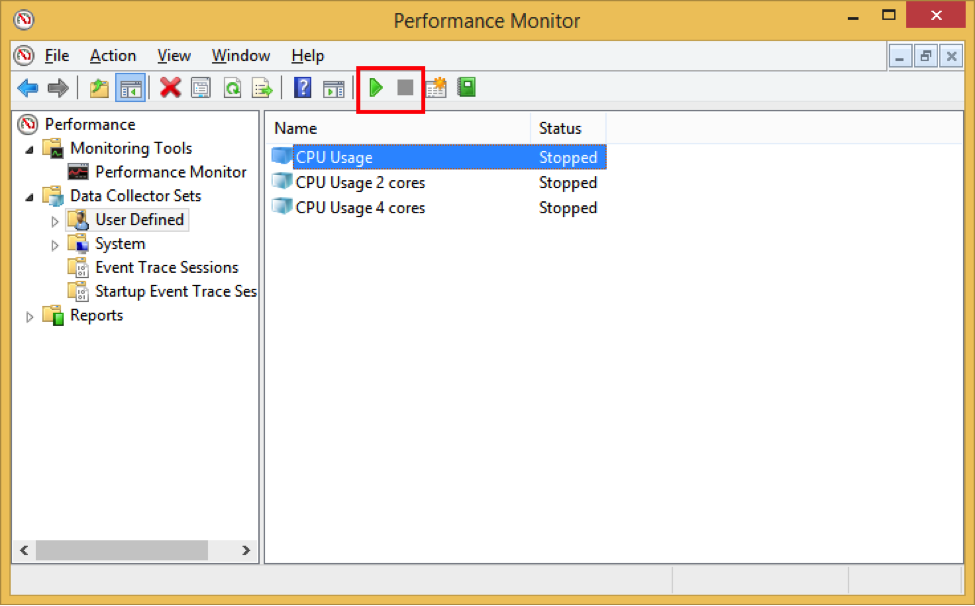
6. Choose a location to save the data capture. Every time you run the capture, it will create a new folder in that location. You can click "Finish" at this point. When you want to begin capturing CPU load data, select the Data Collector that was created and press the green arrow button on the top toolbar. To stop, press the black square next to it.
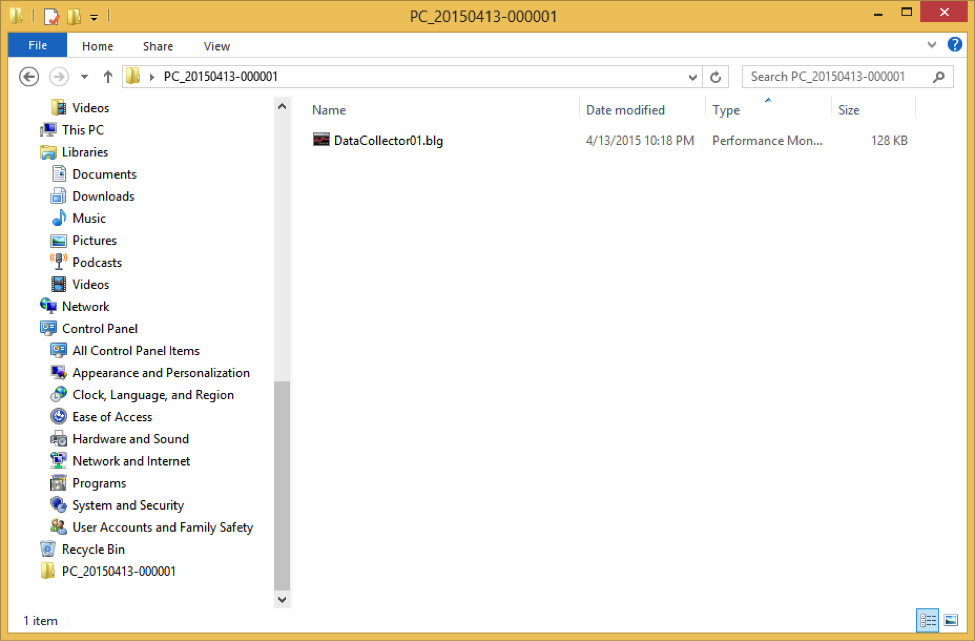
7. To open the captured data, locate the folder where you saved it and find the file named DataCollector01.blg. Opening that file will present a graph of the data capture.
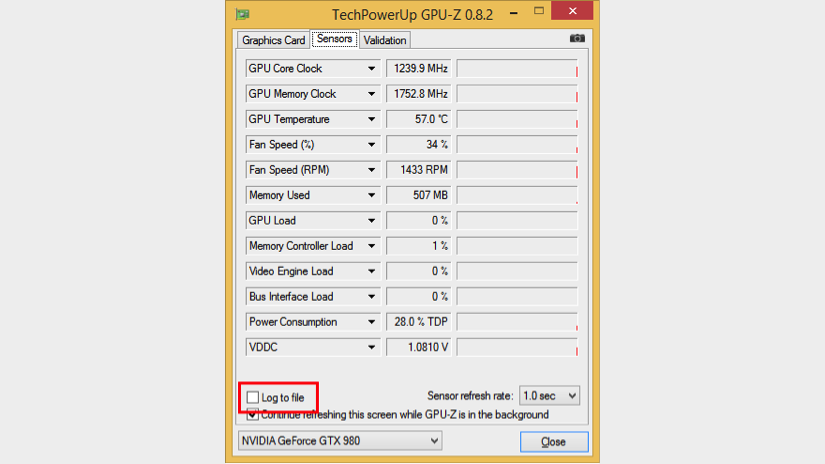
8. To start a video card data capture in GPU-Z, go to the "Sensors" tab and tick the "Log to file" checkbox at the bottom. It will ask you where to store the log file. To stop logging, tick it again.
If you have Microsoft Excel or a similar program, you can change the extension of the GPU-Z log file to ".csv" and it will format it to be spreadsheet-friendly.
