Wait, how do you check your CPU temperature?
Processors can withstand a lot of heat, but how hot is too hot?

Processors need a cooling solution for a reason, whether it's air or liquid. They can get hot. Like, really hot. Most desktops CPUs will run in the 50-70°C (that's 122-158°F) range under load, and a combo of good cooling and carefully-applied thermal paste should keep your CPU in that range. It's possible you'll see 80°C or higher if you're overclocking, but that should only be a cause for concern if you're running at stock speeds. So, how do you check your CPU temp?
How hot your PC case gets on the outside isn't a reliable indicator of the state of your components. (Although you should be regularly dusting the inside. Every nook and cranny, fans especially.) Thankfully, it's easy to monitor your CPU temperature in real time, whether that's with third party software or RGB components that change color to indicate different temperature ranges. Monitoring software is going to be your best bet, since it will give you detailed information.
How hot is too hot?
Anything in the 90°C range and over is cause for concern, whether you're overclocking or not. Overheating can adversely affect the longevity of your CPU, shortening its life-span to under a year, or cause other issues like throttling. If your PC abruptly shuts down, inexplicably reboots itself, gives you a beep code at start-up, or a blue screen error, those are all signs you are pushing your processor beyond its limits.
Article continues belowFixing overheating issues can be as simple as applying new thermal paste, dusting the fans, or upgrading from an air cooler to a liquid cooler, as liquid cooling transfers heat more effectively than air. On average, liquid cooling can lower your CPU temp by 10-15 degrees. Not everyone needs liquid cooling, but one thing to watch out for with air cooling is overloading the cooler; if you have a CPU doing 200W with a 150W air cooler, it could overheat and throttle.

What monitoring software should I use?
HWMonitor
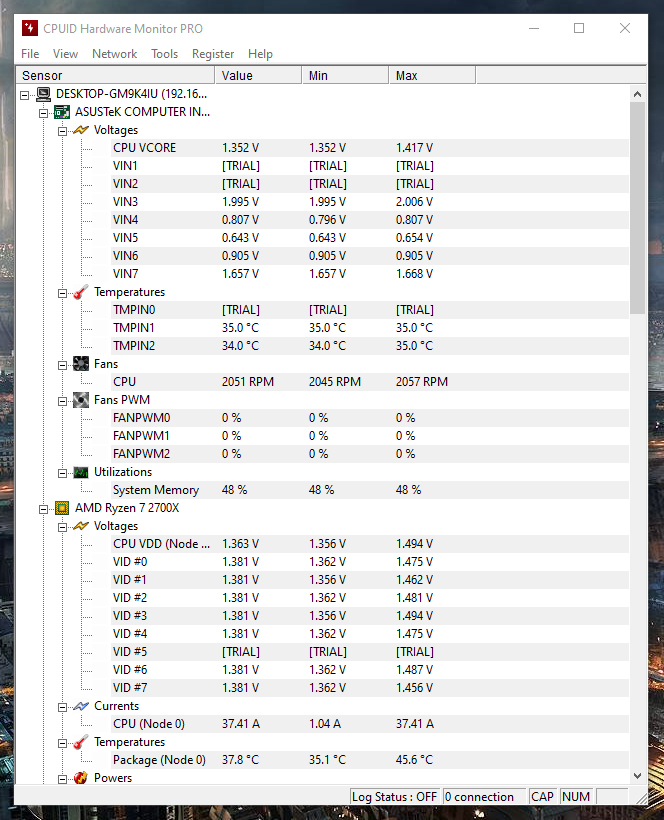
Our favorite software tool for monitoring your CPU temperature, HWMonitor is geared toward those who really want to dig into their gaming PC's temperature stats. It doesn't have the prettiest user interface around, but not only does it real-time monitor the value, minimum, and maximum temperatures of your CPU, but it measures other things like per-core utilization and clock speed.
HWMonitor also keeps track of the temperature, fan speed, and utilization of your other hardware components, too. It may seem like a lot, but if you only want to focus on you CPU, you can collapse the other categories so you don't get overwhelmed with rows and columns of numbers. You can also view you components by device or sensor type, and change the labels under every category—so you could rename every CPU core in the powers category to a Power Ranger if you really wanted to. (No? Is that just me?)
Keep up to date with the most important stories and the best deals, as picked by the PC Gamer team.
CAM
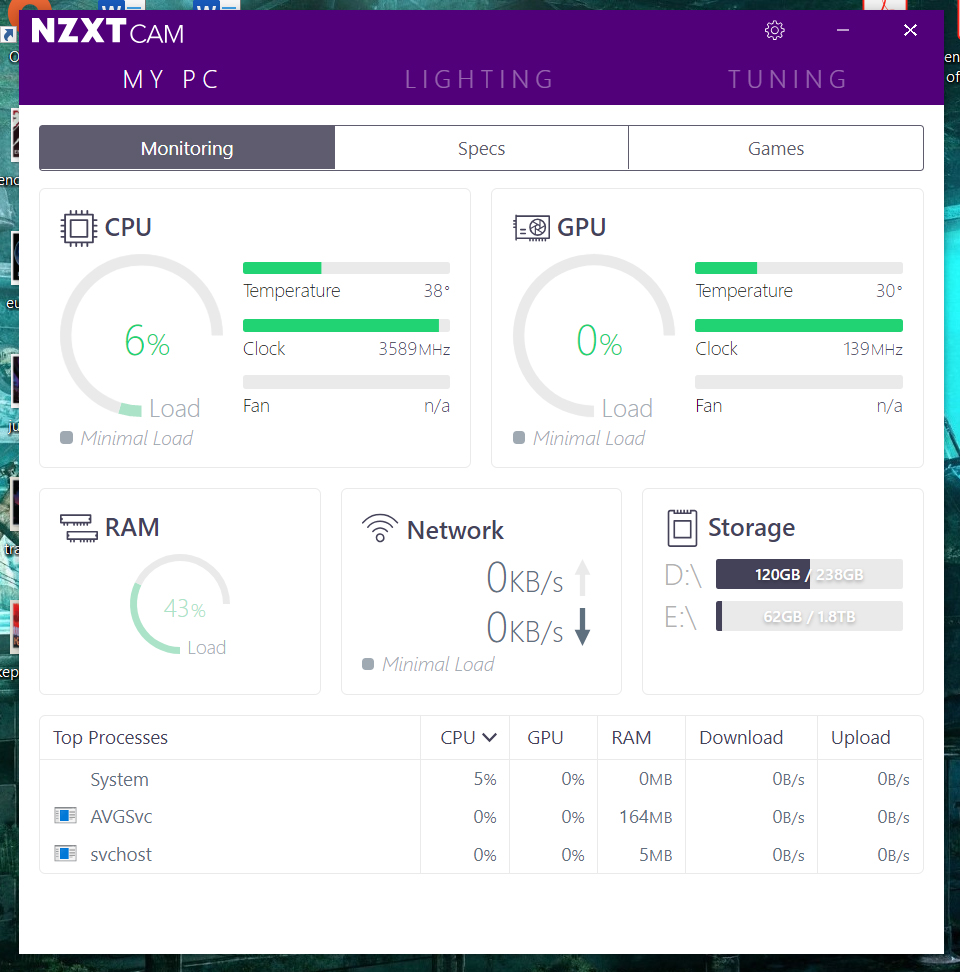
For those who want to simply track their temperatures without much fine tuning, NZXT's CAM software is great because of its visually pleasing user interface. It has a mode that tells you the temp, load, clock and fan speed of your CPU, as well as your GPU, in real-time. You can also adjust the clock speeds from CAM.
It comes with certain cases, like the H700i, but even if you don't have any NZXT components in your build, you can still download it for free. The user interface will look different, but it still clearly conveys the information you need.

HWiNFO 64
If you want even more data, HWiNFO 64 is the way to go. When you first start the program, it will give you the option to run it in two modes: sensors-only and summary-only. Sensors-only is a long list of numbers like HWMonitor, but presented in a different way. Most of the information it gives you is the same as HWMonitor, but instead of collapsing categories to minimize how much you have to scroll, HWiNFO 64 give yous the option to open your PCs vitals in horizontal boxes, like so:
Of course, having it open like that is not practical while gaming if you have only one or two monitors, but it's a nice alternative to scrolling and collapsing categories manually.
Core Temp
Core Temp keeps it simple, only monitoring the temperature and load of your CPU. Not only does it display these stats in real time, and for each individual core, but the temp for each core is also added under the 'show hidden icons' button in your task bar. Hover over each colorful number and it will tell you which core that temperature is associated with. However, those numbers will only be there if the program is open.
On another note, do watch out for the bloatware that comes along with the installation file. It comes with a management sim mobile game called Goodgame Empire. Be sure to un-check that box before you install, as well as the box for a shortcut to Core Temp Addons, which is basically the same program just a different version of it. The main application will give you everything you nee.
SpeedFan
Yet another option for monitoring the temperature of your CPU and other components, SpeedFan focuses on giving you manual control over fan speed to keep your CPU as cool as possible. It's a bit more complicated than the previous monitoring programs listed here, but if you really like fine-tuning fan speed, especially of you have an air cooler, this is the program you need.
Open Hardware Monitor
Open Hardware Monitor looks and feels similar to HWMonitor, but it comes in a standalone zip and you don't need to actually install it on your PC. Other than that, it does almost everything that HWMonitor does.


 Join The Club


