Doom benchmarks return: Vulkan vs. OpenGL
What does the new API mean for graphics performance?

Doom Vulkan performance comparisons
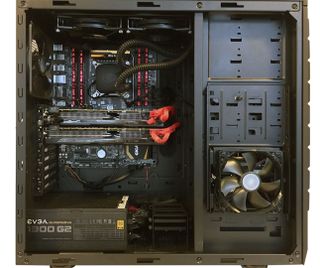
CPU: Intel Core i7-5930K @ 4.2GHz
Mobo: Gigabyte GA-X99-UD4
RAM: G.Skill Ripjaws 16GB DDR4-2666
Storage: Samsung 850 EVO 2TB
PSU: EVGA SuperNOVA 1300 G2
CPU cooler: Cooler Master Nepton 280L
Case: Cooler Master CM Storm Trooper
OS: Windows 10 Pro 64-bit
Drivers: AMD Crimson 16.7.2, Nvidia 368.69/.64
For the benchmarks, I'm using my standard testbed, which you can see to the right. I didn't do a full set of additional CPU scaling tests this round, due to time constraints, but I did a few quick spot checks that I'll discuss below. I've also retested every single graphics card in the charts, with OpenGL 4.5 and Vulkan, using the AMD Crimson 16.7.2 drivers and the Nvidia 368.69 drivers—the exception being the recently launched GTX 1060, where I used the 368.64 drivers. Some of the OpenGL numbers have improved a bit since the initial testing in May, so I wanted to keep things consistent.
For the charts, I've separated each resolution into AMD and Nvidia hardware, and colored Vulkan results red and OpenGL results blue. (Trying to put everything into one chart just resulted in a massive pile of results that ends up not being particularly readable, though if you're interested, here are the full 1080p, 1440p, and 4K results.) I'll discuss each chart in turn, starting at 1080p. I could have also tested at 1080p High or Medium quality, but the gains in performance aren't all that great and at some point I had to draw the line and simply finish the testing.
One thing to note is that my Doom benchmark sequence uses FRAPS for OpenGL and PresentMon for Vulkan, and there is a bit more variance between benchmark runs than some other games. Basically, I play a 150 second sequence (give or take) where I run though a section of the game and fight a bunch of hellspawn. I do my best to run the same path each time, but there are minor variations depending on where the demons show up. Testing the same card at the same settings multiple times gives a variance of around four percent, so anything less than that can be considered equivalent performance—not that you'd really notice anything below ten percent anyway.
In case you're new to my testing, I also report minimum frame rates, but these aren't strict minimums. Instead, I calculate the average fps for the bottom three percent of frames. This is done by finding the 97 percentile (the value where 97 percent of frames render faster, using the frame times) and then selecting the remaining three percent of frames and finding their average fps (total number of frames divided by seconds). I do this because sometimes there's a single frame out of thousands of frames that 'glitched' or whatever, and in practice it's far more useful to know what typical minimum fps is like rather than focusing on that one frame.
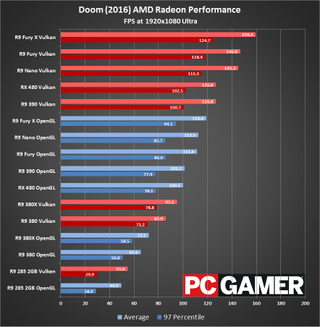
AMD starts off with an impressive showing at 1080p Ultra, with nearly all of the cards showing around a 30 percent performance improvement compared to OpenGL. That's a massive jump, and what's more it happens even on lower-end hardware like the R9 380—not that any of these are 'slow' GPUs, but it's good to see improvements on more than just the high-end parts. The one exception here is the R9 385 2GB, which is the only AMD card with less than 4GB VRAM that we tested; it improves, but by roughly 10 percent instead of 30 percent. Minimum fps is also up significantly, though the nature of testing creates a lot more variation between runs when talking about minimum fps; the 285 shows almost no change, while the other cards are all 30-40 percent higher on 97 percentile scores.

In contrast to AMD's hardware, Nvidia's showing with Vulkan is a lot more mixed. The GTX 1080 performance goes up by 20 percent, the 1070 improves by 10 percent, and most of the remaining cards fall within the margin of error. We do see a few performance regressions, and the GTX 950 shows a nearly 10 percent drop with Vulkan. The 2GB 960 also shows a small drop, and interestingly the 1060 does as well—perhaps the 368.64 drivers aren't fully baked, or it might just be variance between runs. Vulkan does generally improve minimum frame rates, and only the 950 shows a clear drop in minimum fps. The 1060 has a small drop, while other cards show a 10-20 percent improvement—the 1080 even shows a 50 percent improvement, and I should note that the 1080 is frequently hitting the 200 fps frame rate cap that Doom imposes, so potentially it could run faster.
Pulling back to talk about the entire spectrum, Nvidia's 1080 and 1070 still claim the top spots, with the Fury X effectively tying the 1070. The 980 Ti, Fury, and Nano all cluster together, followed by another grouping of the 980, 480, and 390—in that order. Vulkan basically elevates AMD's GPUs from seriously lackluster positioning in Doom to being right in the mix.
The biggest gaming news, reviews and hardware deals
Keep up to date with the most important stories and the best deals, as picked by the PC Gamer team.
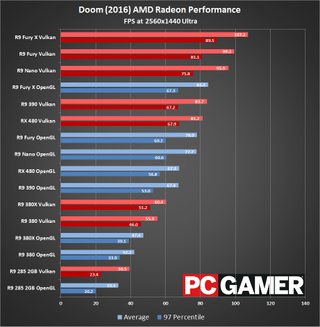
Again, AMD delivers some massive improvements at 1440p, showing that Vulkan isn't just a case of reducing CPU bottlenecks but it's also allowing the software to extract additional performance from the hardware. Average frame rates are up by 20-30 percent on everything, this time including the R9 285 2GB. Minimum frame rates show similar and even slightly higher improvements, ranging from 15-35 percent.
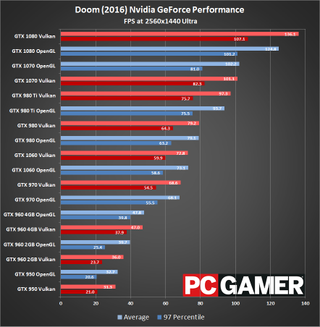
Running a game like Doom at 1440p Ultra usually makes the GPU the bottleneck, and that's basically what we're seeing. The GTX 1080 does get a decent 10 percent boost, but all the other cards are pretty much within the margin of error. The 2GB VRAM cards also tend to be a bit more prone to hiccups in testing, or simply have higher variance; here the 960 2GB drops by nearly 10 percent, but the 950 (also 2GB) shows a barely perceptible dip. Minimum frame rates for all of the cards are within the wider margin of error, so basically at 1440p none of Nvidia's cards beyond the GTX 1080 really benefit.
The lack of improvement on the Nvidia side ends up changing overall positioning a bit. The 1080 remains the fastest GPU, but the Fury X now edges past the 1070—this isn't really that unusual, however, as the Fury X has gobs of memory bandwidth and frequently improves relative to the competition at higher resolutions. The Fury edges past the 980 Ti, which is just ahead of the Nano. Similarly, the 390 and 480 edge past the 980, 1060, and 970. At the bottom of the overall standings, things are pretty much in line with what we usually see: 380X beats 380, and both beat the 960 and 950.

Finally, with settings at maximum (more or less—we're still not running the Nightmare quality options), AMD continues to show moderate improvements thanks to Vulkan. This time the range is more like 15-25 percent, for both average and minimum fps, but the fact that Vulkan is giving the GPUs any help at all at 4K ultra is frankly astonishing. I'm not sure what bottleneck is being alleviated, and all of the cards still fall below the 'magical' 60 fps mark, but if you have a 4K FreeSync display Doom is definitely playable at these settings on the RX 480 and above.
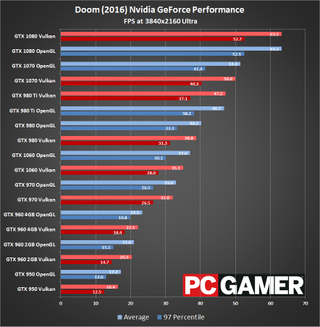
Nvidia on the other hand ends up with slight drops in performance on nearly all the cards we tested. I'd call it bad luck or margin of error, except it's so consistent that more likely there is a slight performance hit at 4K ultra with Vulkan. Either Nvidia's OpenGL drivers are simply so tuned at this point that it's hard for game developers to match them, or some other factor is at play. Of course, the GTX 1080 is still the only GPU to break 60 fps at 4K ultra, even if Vulkan doesn't help out.
The overall picture once more shifts farther into AMD's court, particularly on the Fiji cards with their HBM VRAM. Under OpenGL, Nvidia was the undisputed champion at Doom, but Vulkan tilts the scales to generally favor AMD hardware—at least in terms of a bang for the buck.
On the next page: What this tells us about the current state of low-level APIs.
Jarred's love of computers dates back to the dark ages when his dad brought home a DOS 2.3 PC and he left his C-64 behind. He eventually built his first custom PC in 1990 with a 286 12MHz, only to discover it was already woefully outdated when Wing Commander was released a few months later. He holds a BS in Computer Science from Brigham Young University and has been working as a tech journalist since 2004, writing for AnandTech, Maximum PC, and PC Gamer. From the first S3 Virge '3D decelerators' to today's GPUs, Jarred keeps up with all the latest graphics trends and is the one to ask about game performance.
Most Popular


